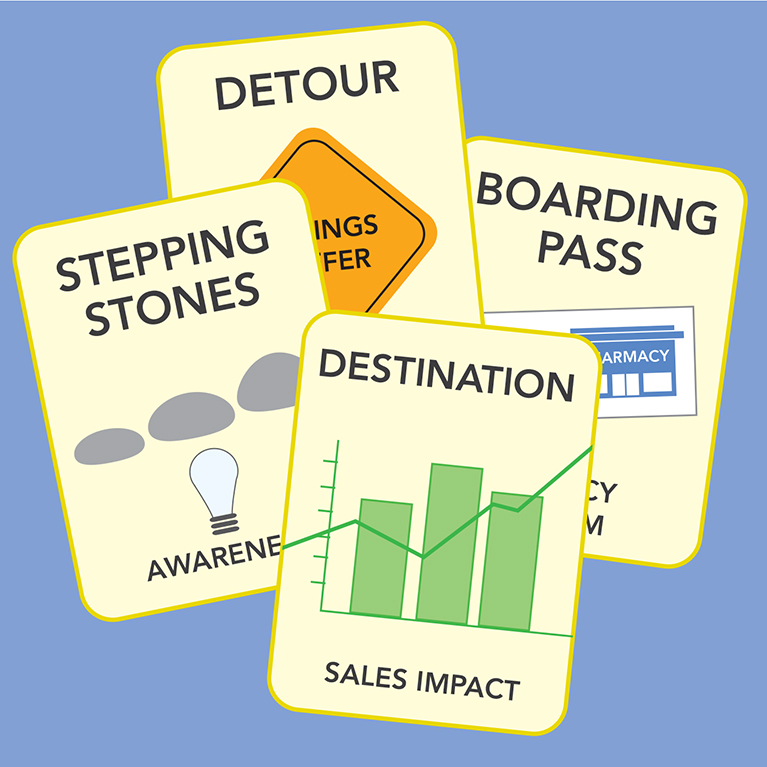
Stepping Stone: Awareness
Generating awareness for a pharmaceutical brand and acquiring new patients are always top priorities for brand managers. Generating responses to offers, website visits, call-ins to pharma toll free numbers, FaceBook likes, or Twitter followers can all be good indicators of an increase in awareness. Generally speaking, brands will utilize a multichannel approach when it comes to marketing campaigns. This can present a problem in terms of measurement. Although the number of website visits or Facebook likes or what have you can be counted, how can they be attributed to actual changes in awareness or acquisition of patients, or to an increase in prescription volume? This is where such “diagnostic metrics” fall short. Brand managers can often get so caught up in the detailed aspects of this number-counting that they will lose sight of any campaign’s true goal. Awareness, in the end, is just the stepping stone to the true destination, sales impact.
Destination: Sales Impact
As in life, it is important to step back and look at a something as a whole, to get the big picture. You wouldn’t look at a Van Gogh dot painting and just pay attention to a few dots in the corner, would you? No, rather, you would step back a bit to view the painting as a whole, and suddenly those few specks of dots become a picture, the big picture. This is what brand managers need to do with their campaigns. And when they do step back, they will see what really matters: reaching prospective patients with information they can use, and achieving a sales increase at an efficient return. That’s their finished painting.
Detour: Response Rates
Response rates to an incentive like a $20 co-pay card or a discounted first prescription or even a limited free trial are often looked at closely, as they can be a contributing factor to overall program success. Because they are a clear statistic, these metrics are more quantifiable than something such as a FaceBook like. However, redemption rates are historically very low. For the non-food CPG sector, on average, redemption rate for a coupon that is “instantly redeemable” is around 3.7%.1 When a coupon cannot be redeemed right away and requires an extra step like mailing-in, the average response decreases significantly to less than one percent. Why is this? Well, people over time will eventually forget about the coupon, lose the coupon, or leave the coupon at home when they need to actually use it. Or, another offer will come along in the meantime.
Pharma faces a similar but even more pronounced situation. The process from initial receipt of an incentive to eventual redemption is a very long one: an appointment must made, the doctor must be seen, the doctor may give the patient a different trial offer or nothing at all, and after all this the patient is expected to keep and remember to use the offer during prescription pick-up at the pharmacy. That is an odyssey of a journey. Nevertheless, sometimes brand managers will focus in on these numbers with great expectations. Patients’ usage of incentive programs are a contributing factor to sales, yes, but should not be considered a decisive goal. Response rates in this regard are a detour, as managers can spend a lot of time trying to figure out why an offer was not ultimately redeemed. But just because incentives are not used, does not mean a campaign was unsuccessful. Only a review of overall sales will determine whether or not the campaign was a success.
Boarding Pass: In-Store Programs
Where the aforementioned awareness indicators are often ineffective in quantifying sales, measurements for a pharmacy-delivered program succeed. One of the benefits of in-store programs is that the prescription product that is being sold is in the same location as the marketing communication itself. This means that a direct link can be established between increased sales and the pharmacy-delivered communication. From there it is as simple as matching and comparing stores that had the marketing program, with stores that did not. Store within a three-level zip code that share similar demographics and previous sales volume are chosen for the best possible matches. This is called a matched-panel analysis; through its usage, a comparison is made that will showcase the direct effect of the campaign on prescription volume. These numbers will be your boarding pass to your final destination, revealing the big picture that other metrics could not.
1 Inmar 2013 Coupon Trends Report